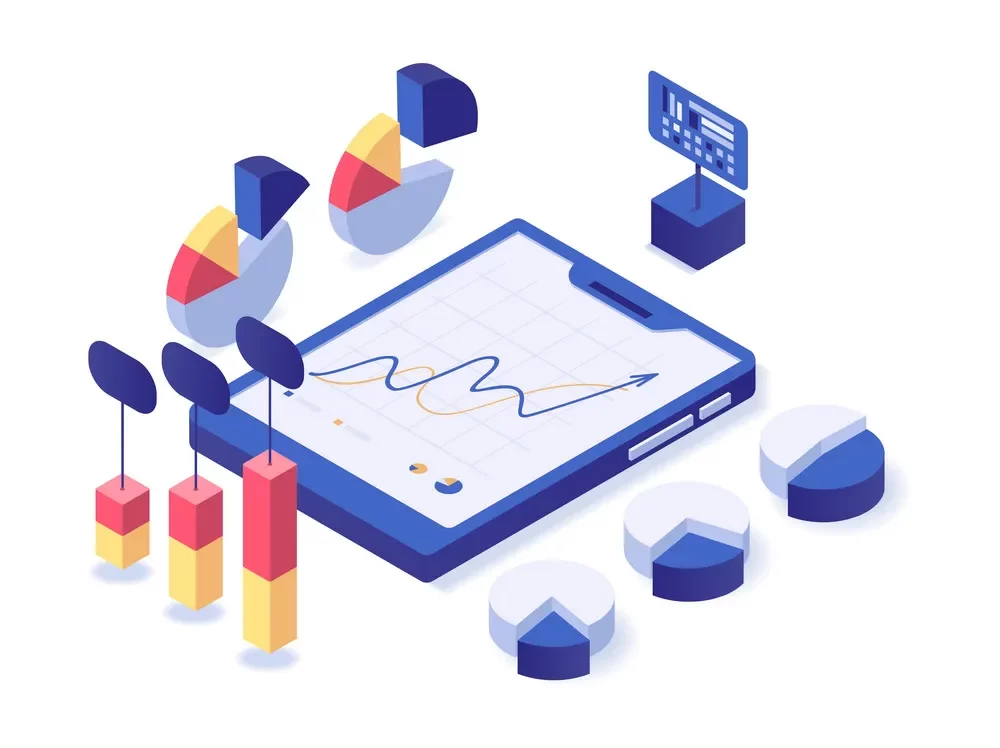
In today’s data-driven world, businesses and organizations generate a vast amount of user log data. Understanding and extracting meaningful insights from this data is crucial for informed decision-making and optimization. The “User Log Data Visualization” project was born out of the recognition of this need. It aims to transform complex log data, often stored in JSON format, into easily digestible and visually informative representations.
Leveraging the power of Natural Language Processing (NLP) and the versatile visualization capabilities of Tableau, this project seeks to provide a comprehensive solution for businesses to gain valuable insights from their user logs. By doing so, it empowers decision-makers to make informed choices and improve user experiences, ultimately driving growth and success.
ABOUT
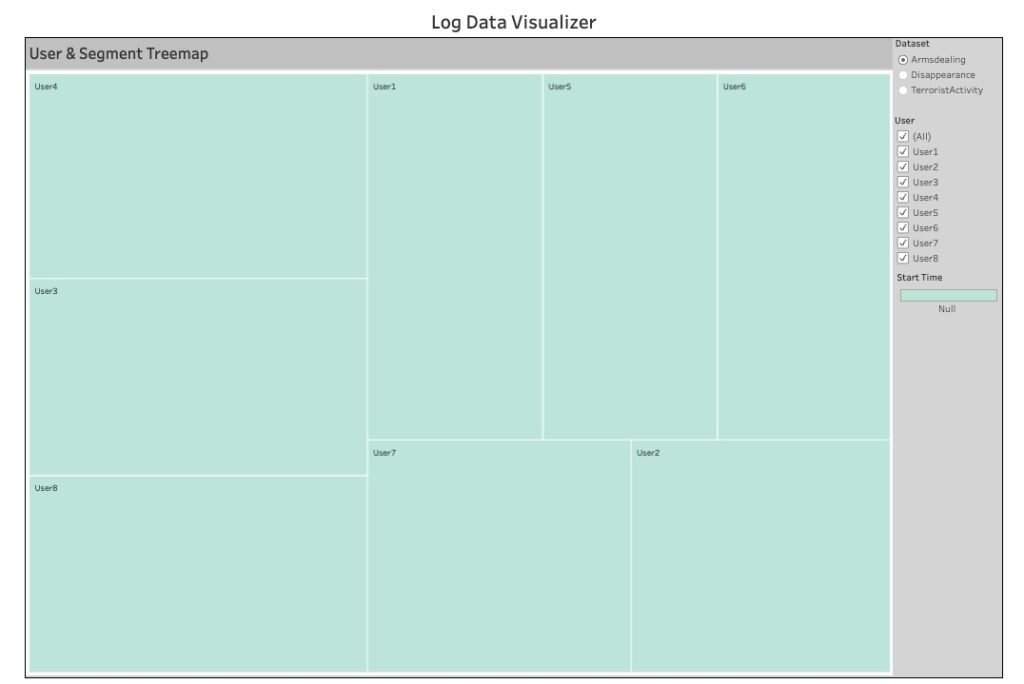
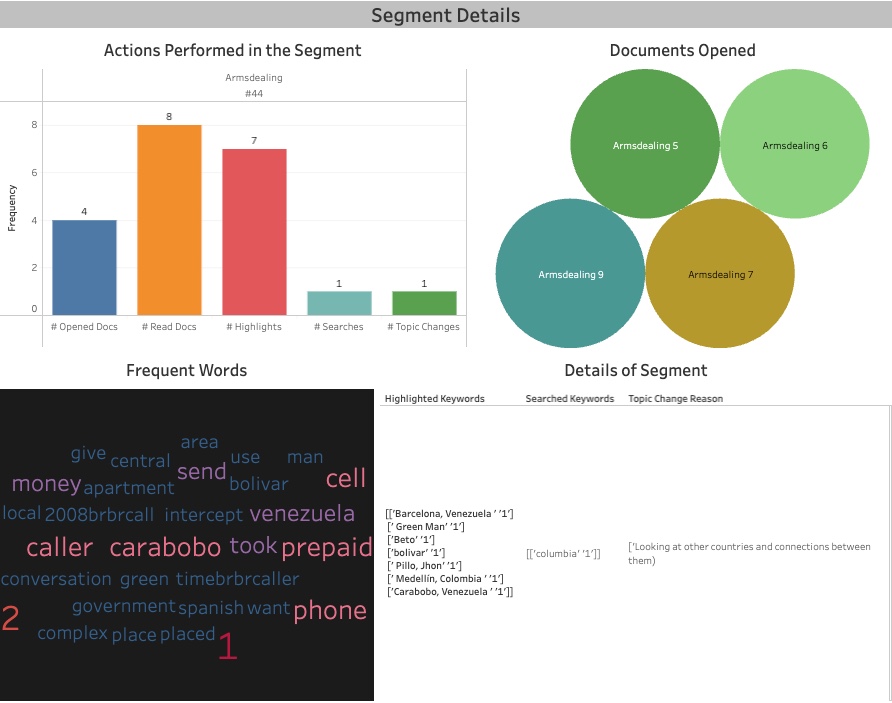
The “User Log Data Visualization” project represents a cutting-edge initiative that bridges the gap between raw log data and actionable insights. Our approach begins with the meticulous analysis of user log data, often presented in JSON format, using advanced NLP techniques. This initial phase involves extracting relevant information and structuring it for further analysis. Once the data is prepared, we harness the power of Tableau to create visualizations that enable users to explore and interpret log data effortlessly.
These visualizations offer a wealth of insights, from user behavior patterns to system performance metrics. Whether it’s optimizing user experiences on a website or fine-tuning a mobile application, our project provides a versatile and user-friendly tool to unlock the potential hidden within user log data.
Year
2023
Affiliation
University of Florida
Services
Data Analysis, NLP
Project
Data-Science
Description
The “User Log Data Visualization” project transforms complex user log data, often in JSON format, into actionable insights through NLP analysis and Tableau visualizations. It empowers businesses to optimize user experiences and make data-driven decisions.
I built a Python-based web tool using NLP, Seaborn, and Tableau, achieving a 90% data connection accuracy rate and enhancing data comprehension. The interactive website I designed and developed utilizing Python and NLP techniques further contributed to this success, highlighting my commitment to effective solutions for user log data.